How much did wind farms cost in 2025?
2025 will go down in energy history. The world's installed renewable energy capacity increased by a record more than 690 GW, representing growth of around one-fifth compared with the previous year. Solar and wind power were the main drivers of this boom, accounting for the vast majority of newly connected capacity. At the same time, a major milestone was reached: for the first time in history, renewables surpassed coal in total installed capacity and became the world's largest energy source. Asia, especially China, remains the main driver of this growth, accounting for almost two-thirds of new solar parks and around three-quarters of new wind turbines.
Technology trends and market developments
Wind power added an impressive 159 GW of new installed capacity in 2025, with onshore wind farms accounting for 93%. China alone brought almost 120 GW of wind power capacity online.
However, the sector as a whole is gradually reaching technological maturity. The era of dramatic cost reductions seen in the previous decade is slowing, and Western markets are facing pressure from rising component prices, driven by more expensive raw materials and higher financing costs. Fossil-fuel power is facing similar challenges, though: a global shortage of gas turbines has nearly doubled investment costs for new gas-fired power plants in the United States.
Total investment costs
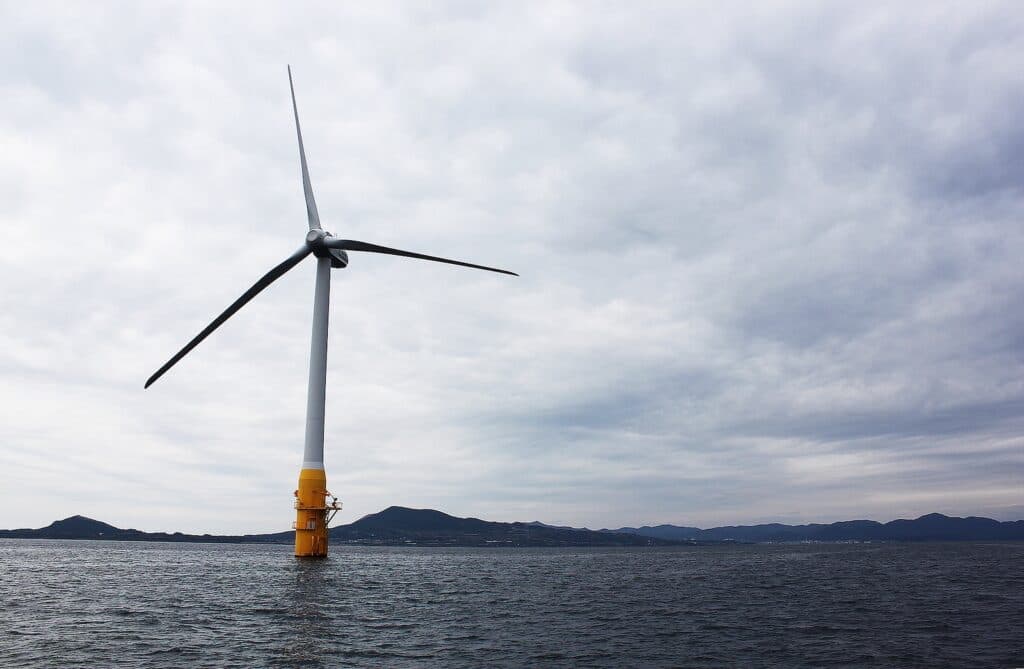
The global weighted average investment cost for onshore wind farms fell to 976 USD/kW, with China reaching a record low of 789 USD/kW. Investment costs for offshore wind farms remained stable at around 2 931 USD/kW. Significant regional differences are evident here, too: Asian projects are generally cheaper than comparable wind farms in Europe or North America.
Capacity factor (utilisation)
The capacity factor shows how effectively a power plant uses its installed capacity over the course of a year. In other words, it indicates how much electricity it actually generates compared with how much it could generate if it operated continuously at full capacity. In 2025, onshore wind farms had an average global capacity factor of 36%, while offshore wind farms recorded a slightly higher figure of around 41%, thanks to steadier and stronger wind conditions.
Operating and maintenance costs
Operating and routine maintenance costs for onshore wind farms have fallen by a substantial 71% since 2010. Offshore wind farms, by contrast, remain significantly more expensive to operate because of more challenging logistics and the harsh marine environment.
Levelized cost of electricity (LCOE)
The LCOE (Levelized Cost of Electricity) represents the average cost of generating one megawatt-hour of electricity over a power plant's lifetime. It includes investment, operation, maintenance and financing, making it possible to compare the economics of different technologies objectively.
In 2025, onshore wind farms had a global average LCOE of 33 USD/MWh. China recorded the lowest costs (27 USD/MWh), while in Germany, for example, costs stood at 52 USD/MWh, owing to more demanding permitting procedures and higher construction costs.
Offshore wind had an average LCOE of 78 USD/MWh. Chinese projects averaged around 49 USD/MWh, while US projects reached as much as 141 USD/MWh. Wind power thus continues to confirm its position as one of the world's cheapest sources of new electricity generation.
In the next instalment, we will focus on solar power, which, together with wind power, forms a key pillar of current renewable energy development.
Translation disclaimer
This article is a machine translation of the Czech original and has not yet been fully reviewed. In case of any doubt, please refer to the Czech version.