
25 September 2026, 09:51
Loading...
Freezing weather drives up electricity prices, especially in France

David Vobořil
26 February 2018, 06:34

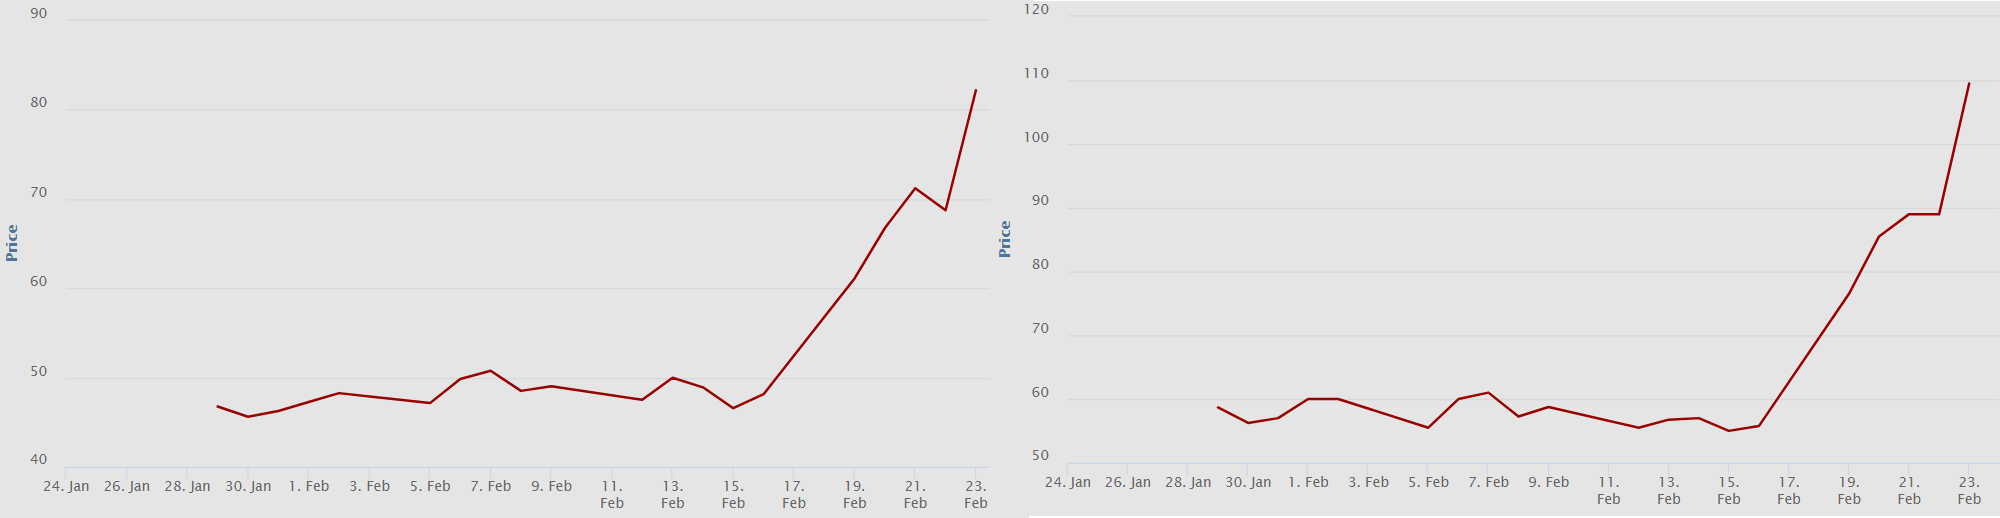
Freezing temperatures that swept across Europe last week drove electricity prices up. Markets are responding to the expected increase in consumption. The largest price rise is evident in France, which has a high share of electric heating.
Electricity prices in France for delivery this week rose above 80 Eur/MWh last Friday for the baseload contract and to 110 Eur/MWh for the peakload contract. Since 15 February, they have thus increased by around 60% (baseload) and 100% (peakload), respectively. The reason is the high share of electric heating in France. According to data from the European Network of Transmission System Operators for Electricity (ENTSO-E), a one-degree Celsius drop in temperature (between 18 and -11 °C) increases load in the French power system by 2.3 GW.
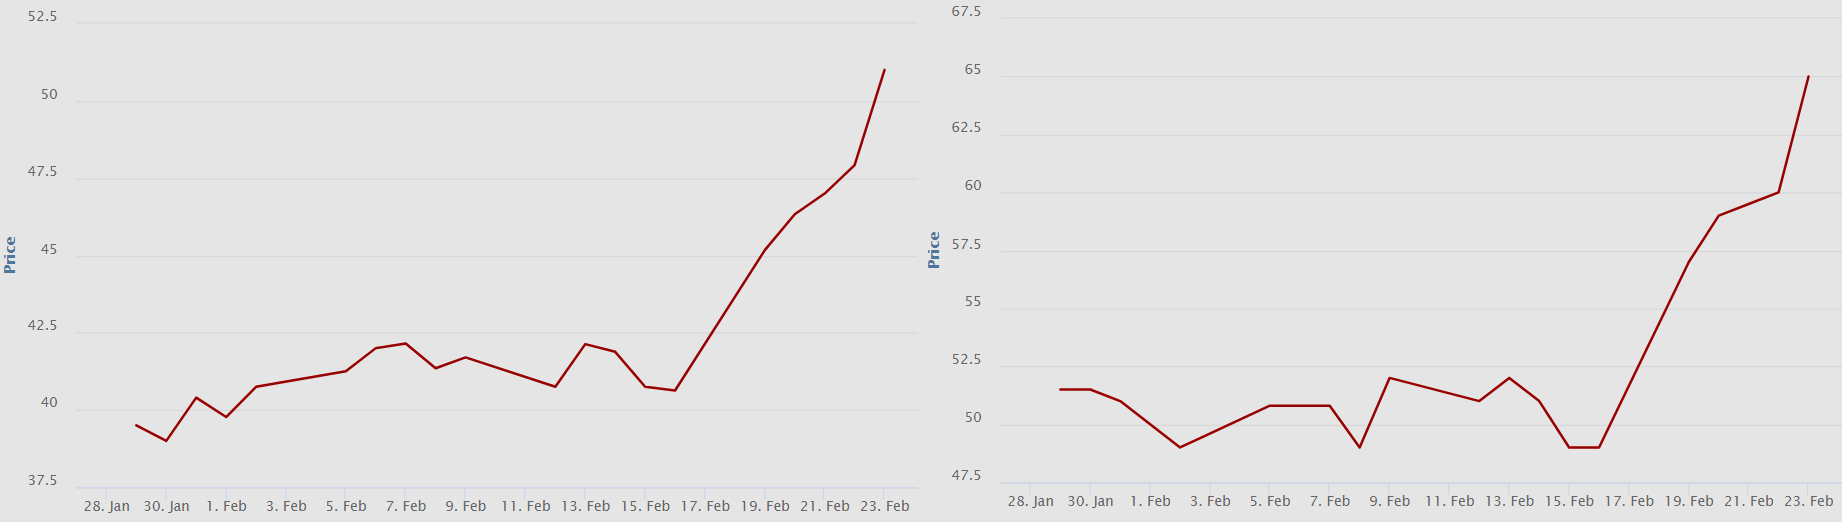
Electricity prices also rose in Czechia, although the dependence of electricity consumption on temperature is more than twenty times lower than in France. However, the small Czech market is significantly influenced by prices in Germany, which are interconnected with prices in neighbouring countries' markets. Prices in Czechia therefore also recorded a significant increase, with the baseload price for delivery in week 9 rising above 50 Eur/MWh last Friday and the peakload price to 65 Eur/MWh. In just one week, prices thus increased by around a quarter (baseload) and a third (peakload), respectively.
Interestingly, Czechia has the second-highest temperature in Europe at which heating begins.
Electric heating in Europe. Data source: Winter Outlook 2017/2018, ENTSO-E
| Country | Temperature at which heating begins [°C] | Heating saturation temperature [°C] | Load sensitivity to temperature [MW/°C] |
|---|---|---|---|
| France | 17.86871 | -11 | -2292 |
| United Kingdom | 17.52434 | -3 | -1025 |
| Italy | 15.70459 | -17 | -767 |
| Spain | 16.92228 | -11 | -726 |
| Norway | 16.71784 | -8 | -433 |
| Italy – north | 15.70459 | -17 | -396 |
| Sweden | 14.95883 | -17 | -386 |
| Turkey | 14.3 | -4 | -315 |
| Germany | 16.71461 | -17 | -257 |
| Poland | 16.50964 | -7 | -220 |
| Italy – central-north | 15.70459 | -17 | -219 |
| Finland | 15.11808 | -10 | -198 |
| Netherlands | 16.88754 | -2 | -163 |
| Serbia | 20.54797 | -6 | -162 |
| Greece | 16.83332 | 1 | -132 |
| Romania | 18.59384 | -5 | -123 |
| Belgium | 17.1 | -12 | -120 |
| Bulgaria | 16.8 | -6 | -105 |
| Czechia | 19.80379 | -4 | -104 |
| Portugal | 17.13476 | -17 | -96 |
| Austria | 19 | -6 | -95 |
| Switzerland | 18.9 | -17 | -93 |
| Denmark | 15.20953 | -3 | -88 |
| Ireland | 12.09818 | -17 | -69 |
| Italy – south | 15.70459 | -17 | -63 |
| Hungary | 15.31833 | -1 | -49 |
| Italy – central-south | 15.70459 | -17 | -42 |
| Slovakia | 19.48872 | -2 | -36 |
| Croatia | 15.29003 | -1 | -34 |
| Italy – Sardinia | 15.70459 | -17 | -34 |
| Northern Ireland | 13.3 | -4 | -26 |
| Albania | 17 | -5 | -24 |
| Estonia | 13.4788 | -6 | -22 |
| Macedonia | 16.77798 | -4 | -21 |
| Bosnia and Herzegovina | 15.5 | -4 | -20 |
| Slovenia | 17.64263 | -6 | -19 |
| Italy – Sicily | 15.70459 | -17 | -13 |
| Lithuania | 15.27124 | -13 | -13 |
| Latvia | 14.85936 | -14 | -12 |
| Montenegro | 17.39148 | -1 | -11 |
| Luxembourg | 19.2 | -17 | -6 |
Translation disclaimer
This article is a machine translation of the Czech original and has not yet been fully reviewed. In case of any doubt, please refer to the Czech version.
Sdílejte článek prostřednictvím:
You might also like

24 September 2026, 11:23

24 September 2026, 10:30
24 September 2026, 06:56