
23 October 2026, 14:38
Loading...
How do electricity prices from different energy sources compare in Czechia?
Vladimír Wagner
20 September 2018, 17:01
When comparing the prices of electricity generated from different energy sources, we encounter a wide range of often quite differing figures in the literature. Even so, it is interesting to make at least a broad comparison of the costs of constructing, operating and maintaining, as well as decommissioning, end-of-life facilities.
In a recent article, I sought to present an overview of the costs of building different types of modern nuclear units. A number of commenters objected that, without knowing the other costs arising during operation and the eventual decommissioning of end-of-life facilities, the figures had only limited explanatory value. I promised to look at the available data and make a rough comparison.
Before we turn to further considerations, it is necessary to explain some discrepancies that emerged in the discussion concerning certain figures cited by Michal Šnobr and myself, mainly for Hinkley Point C and Vogtle. As I mentioned in the article, I drew on official data, which predominantly show construction costs. While some changes did occur while the article was being written and the table therefore did not reflect them, most arise because Michal Šnobr follows unofficial investor estimates more closely. These generally already incorporate, to some extent, the impact of the cost of money in a given investment model. They therefore show something different from the construction costs alone reflected in the table.
Let us recall that in the previous article, when comparing different sources, we also had to account for their different lifetimes and capacity factors. For our comparison, we will assume a 60-year lifetime for a nuclear unit and a 30-year lifetime for photovoltaic and wind facilities. We used a rather conservative capacity factor of 85 % for nuclear units, a 30 % factor for wind sources that is rather optimistic for Czech conditions, and an achievable 11 % for photovoltaics in Czechia. The metric we will examine is then the cost of building, operating and decommissioning a set of facilities that supplies 1 GW of output for 60 years. Investment and decommissioning costs must therefore be counted twice for photovoltaics and wind, while the required capacity of the installation will increase in inverse proportion to its capacity factor.
Operating costs for nuclear units can be estimated fairly well from those of existing facilities (an example of a study examining them is here, while others can be found on the WNA website). For example, the first-mentioned study states that, for US nuclear power plants in 2016, median costs were 6.8 USD/MWh for fuel, 20.4 USD/MWh for operations, and 6.7 USD/MWh for maintenance and upgrades. It also shows that these costs do not change radically over time. Specific values differ mainly according to facility size. Total operating costs generally include fuel, maintenance, including repairs and refurbishments, and the provision of operations in a broader context. They sometimes also include contributions towards future disposal. However, we will calculate the cost of permanent disposal separately.
Operating costs for photovoltaic and wind sources are also examined in a number of different sources. I sought instead to use the lower end of the range of estimates, which can be found, for example, here, here, here, here or here. Even these few links show that there is a relatively wide range in the reported values. This is also because individual sources do not always include all cost items. Furthermore, these costs depend considerably on the size of the facility and on the severity of the climatic conditions to which it is exposed. For example, the salty environment faced by offshore wind farms is highly demanding, and questions remain over the actual lifetime of such facilities. The literature gives costs both as a price per unit of energy generated and as a maintenance cost per unit of installed capacity. When converting between them, the relevant capacity factor of the source must be taken into account.
The costs of decommissioning nuclear sources are covered in a number of references. They are again examined in detail on the WNA website. There is already extensive real-world experience and data. The financial cost per unit of capacity is higher for small standalone units than for large reactors. This also explains the relatively wide range.
Estimates of the costs of decommissioning wind and photovoltaic sources per unit of capacity also differ depending on whether they concern small sources or large installed units. Some studies addressing this issue can be found here, here and here.
An estimate of the costs of a permanent repository can be based on the advanced stage of construction of Finland's Onkalo repository. There, construction costs are assumed at EUR 0.5 billion, operating costs at EUR 1.9 billion, and closure costs at EUR 2.5 billion. However, it is intended to serve most Finnish nuclear units. For a repository, the cost per unit of waste disposed of falls relatively quickly as the total disposal volume grows.
The values in the table have been converted into euros and then into Czech crowns. When assessing operating and decommissioning costs for wind and photovoltaic sources, it should be borne in mind that, to achieve the total output of a stable 1 GW source, we need 3.3 GW of wind capacity and 9.1 GW of photovoltaic capacity, and these must be built and decommissioned twice over the 60 years being assessed. Construction cost values for the sources were taken from the previous article. For photovoltaics, the lower end represents costs for large farms benefiting from a substantial price reduction through relocation to China, while the upper end better corresponds to the decentralised model that would be built in Czechia.
As has been stressed several times, there are significant differences between the various references. Different approaches are also often used, and the inclusion of different effects frequently varies. Moreover, costs depend very strongly on the conditions for operating a source at a given location. Construction, operation and decommissioning naturally take place at different times, and future developments are difficult to predict. These factors are generally not included in the analyses. This is why these are only broad estimates and certainly not precise values. I am also not an expert in many of the necessary fields and unfortunately do not have enough time to unravel all the available sources. Like the previous assessment of nuclear construction costs, this consideration is intended to enable everyone to form a broad idea and, where appropriate, supplement, correct or consider various items for the sources that interest them most. They can then conduct their own literature review and form their own opinion. I would therefore also welcome discussion and any additions or corrections.
Conclusion
In general, the table shows that the costs of electricity generated by the sources compared are within similar ranges and are not radically different. The benefits of building them depend on geographical and other conditions in a given region, as well as on the composition of the energy mix and its needs. This also shows that it is sensible to build a diverse mix whose composition corresponds to local circumstances. It should also be stressed that there are many other factors affecting the price of electricity and the viability of a source. Small photovoltaic or wind sources are more costly, but their use in a decentralised form, without the need to transmit electricity over long distances, brings considerable savings and other benefits. Conversely, the advantage of nuclear sources is their independence from weather and stable operation.
For all the sources assessed, total costs of operation over their lifetime are comparable to those required for their construction. Thus, although it is commonly claimed that these sources have “negligible” operating costs relative to investment costs, this is not entirely true. Their operating costs are negligible compared with those of fossil-fuel sources.
Other costs that will also affect the price of electricity from a given source are those associated with the investment model and investment risk. It is precisely for nuclear sources, which represent a major one-off investment, that different investment models produce enormous differences. Where there are state guarantees and consequently low political risk for the project, the investment cost does not rise much. Where all risks rest with the investor, who has to arrange credit and collateral for the project, the cost of the investment can increase considerably. The high price of GBP 92/MWh that the UK must guarantee for Hinkley Point C is to a large extent also due to the chosen financial model. Let us recall that the price for the largest offshore wind farm in the UK, opened recently, is GBP 150/MWh. This can also be illustrated by the difference in the required electricity price for a nuclear unit at different discount rates. In the UK, it is 64 USD/MWh at a 3% discount rate, 101 USD/MWh at a 7 % discount rate and 136 USD/MWh at a 10 % discount rate (WNA source). I am not an economist, so I really do not presume to offer a detailed analysis of this area.
Once again, I stress that the article does not aim to provide a detailed and precise comparison, but merely a qualitative perspective and inspiration for readers' own consideration of the issue and review of the various references.
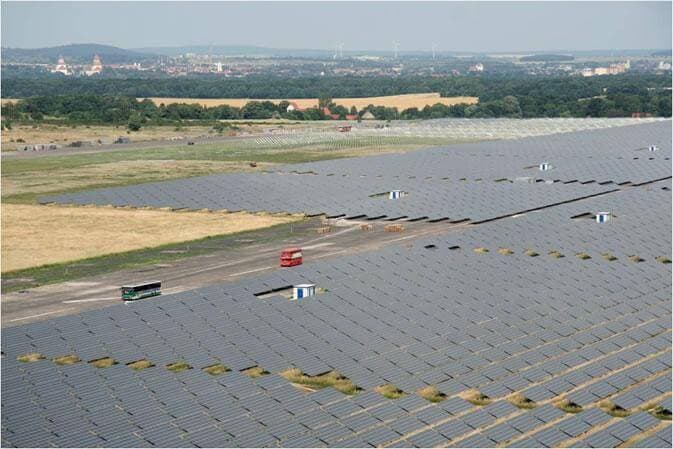
The article was written for the oEnergetice and Osel websites.Lead photo: Waldpolenz solar farm in Germany (source: JUWI Group, Wikipedia)Translation disclaimer
This article is a machine translation of the Czech original and has not yet been fully reviewed. In case of any doubt, please refer to the Czech version.
Sdílejte článek prostřednictvím:
Topics:Opinion
You might also like
23 October 2026, 11:01

23 October 2026, 06:34