23 October 2026, 14:38
Loading...
Path to the decarbonisation of Czech energy – part one
Oldřich Sklenář
10 September 2020, 07:05
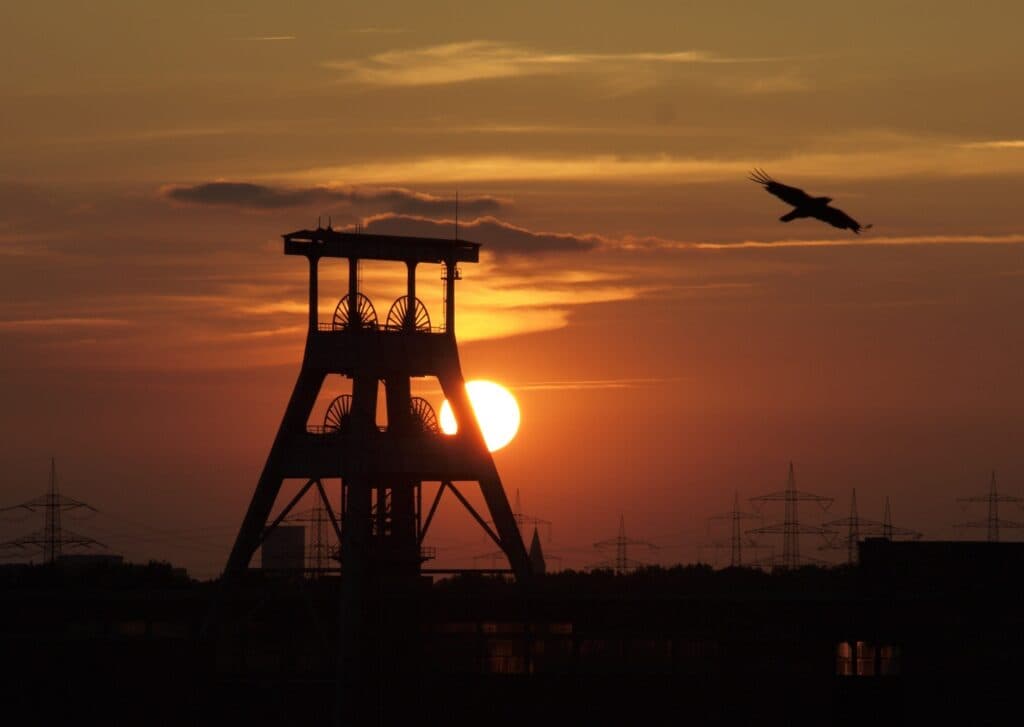
This short series summarises issues related to the decarbonisation process of Czech energy. The opening instalment focuses primarily on the links between the energy sector and ongoing global climate change.
Energy and global climate change
By far the largest anthropogenic source of greenhouse gases is the combustion of fossil fuels, which is linked specifically to the energy sector; see Chart 1.
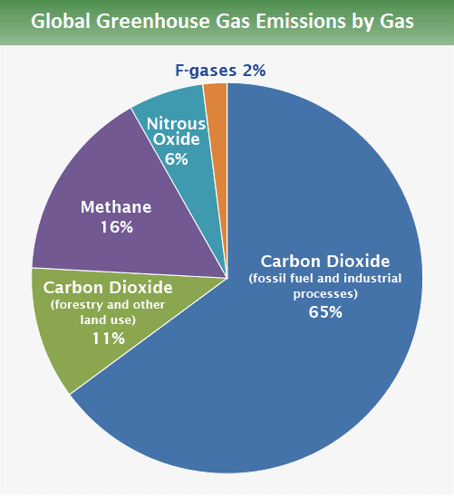
The dominant component is carbon dioxide produced by the combustion of fossil fuels (blue). Further CO2 is generated by activities related to land use and forestry (green). The energy sector, or rather the extraction of energy raw materials and associated leaks, also partly contributes to methane production (purple). Combustion processes, together with the production of artificial fertilisers, for example, are also responsible for nitrous oxide emissions (turquoise).
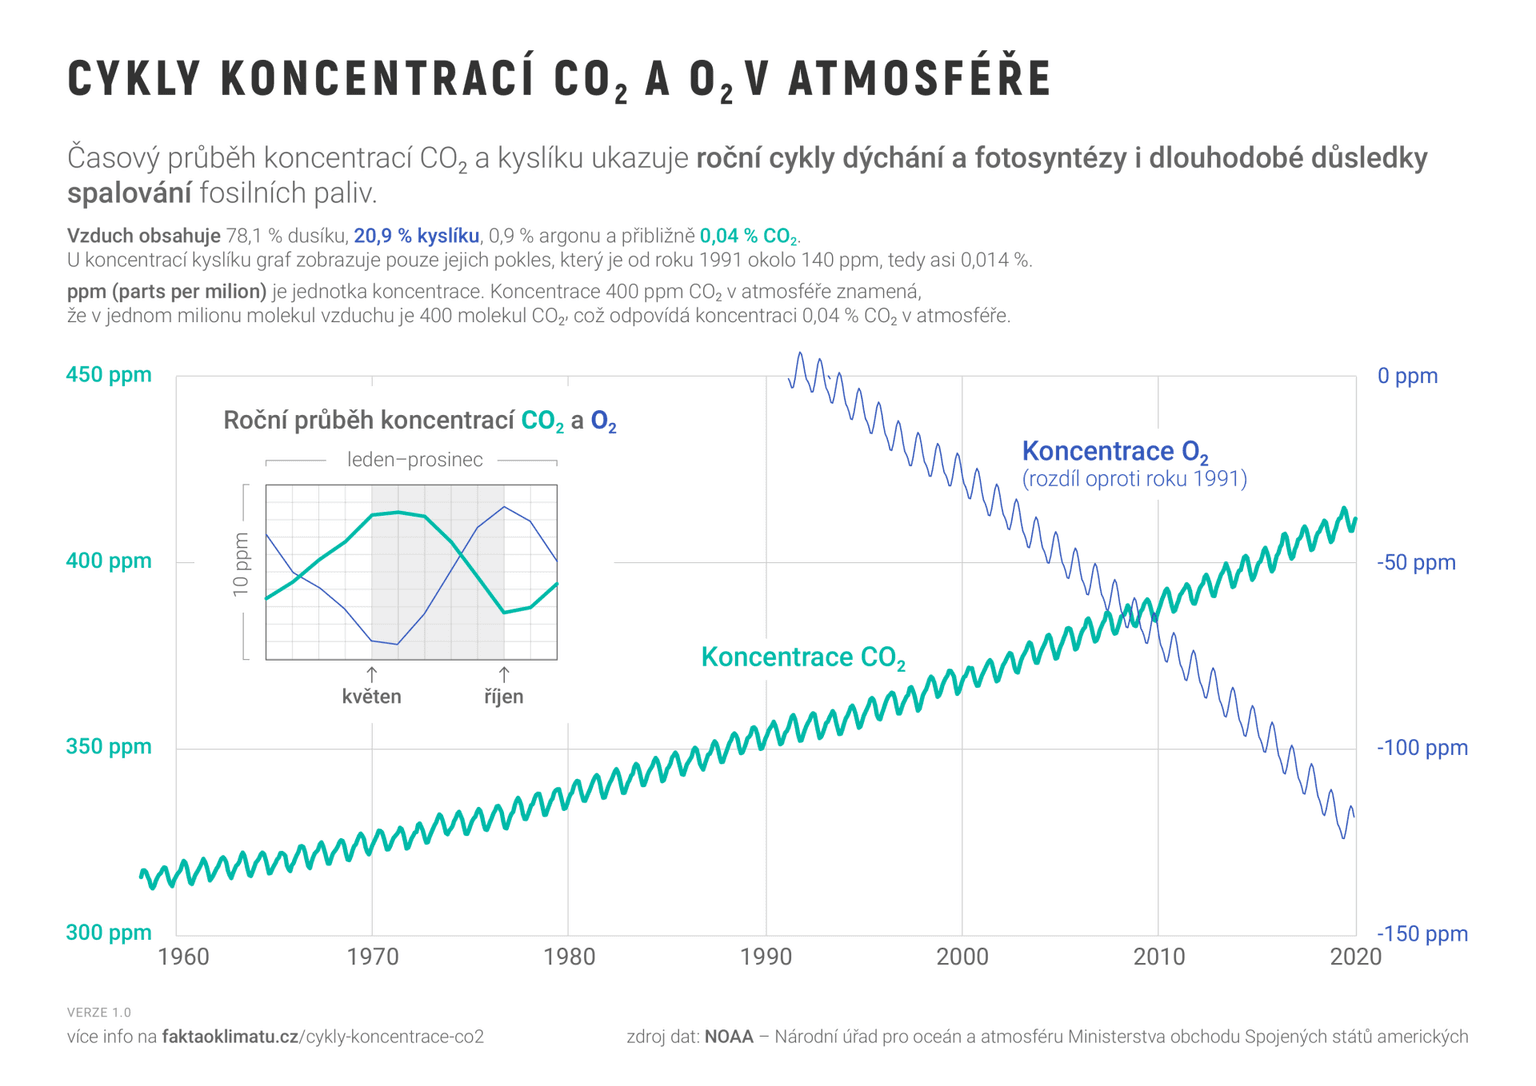
The fact that the rising concentration of CO2 in the atmosphere is linked specifically to the combustion of fossil fuels is clearly apparent from the so-called Keeling curve; see Chart 2. This curve shows the rising concentration of CO2 in the Earth's atmosphere, together with the declining concentration of O2. Their ratio corresponds to the mixing ratios in fossil fuel combustion (after accounting for the absorption of part of the CO2 by the oceans).
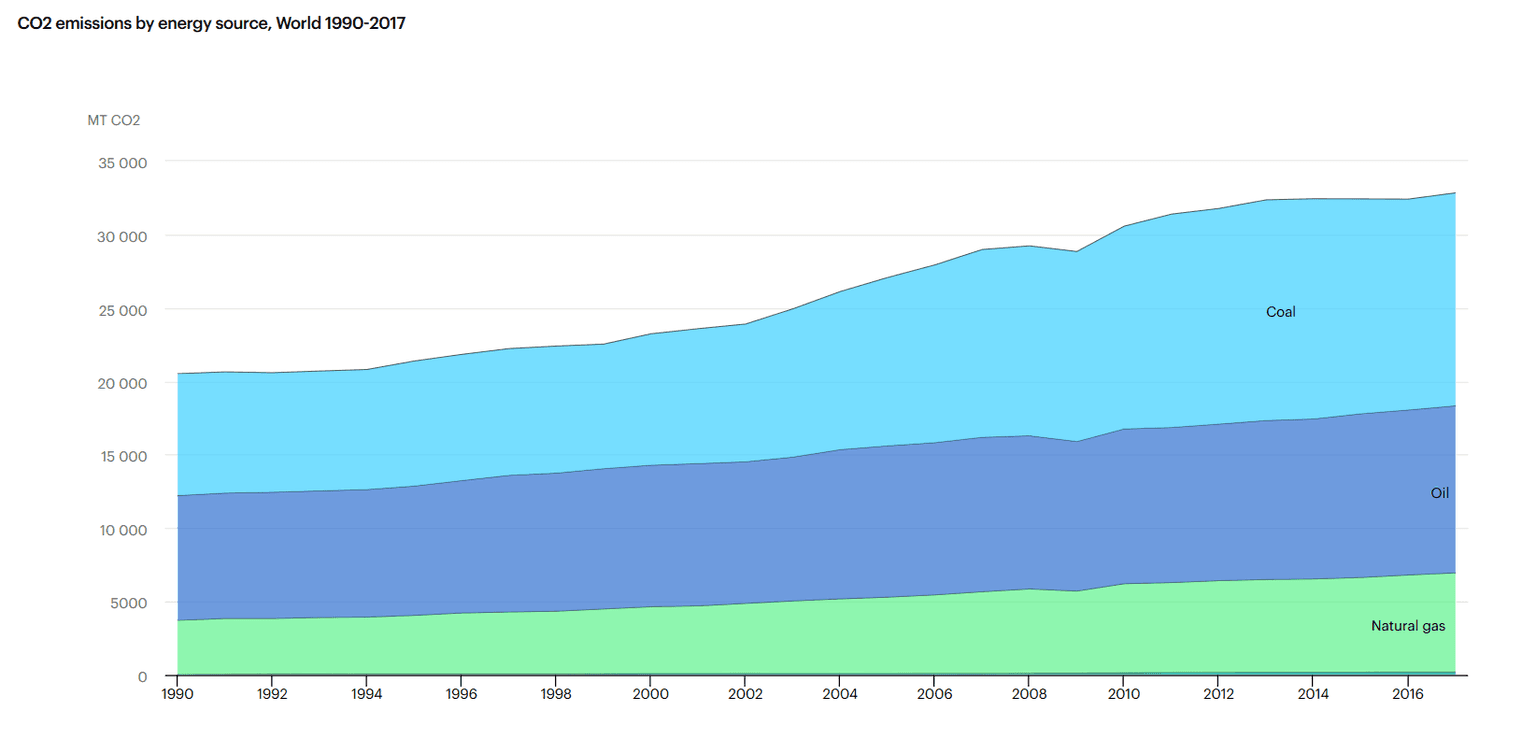
Among fossil fuels, coal combustion is the largest source of CO2, exceeding both oil and natural gas; see Chart 3 below.
Rising greenhouse gas concentrations result not only in higher temperatures, but also in a range of other phenomena; see the schematic Chart 4 below.
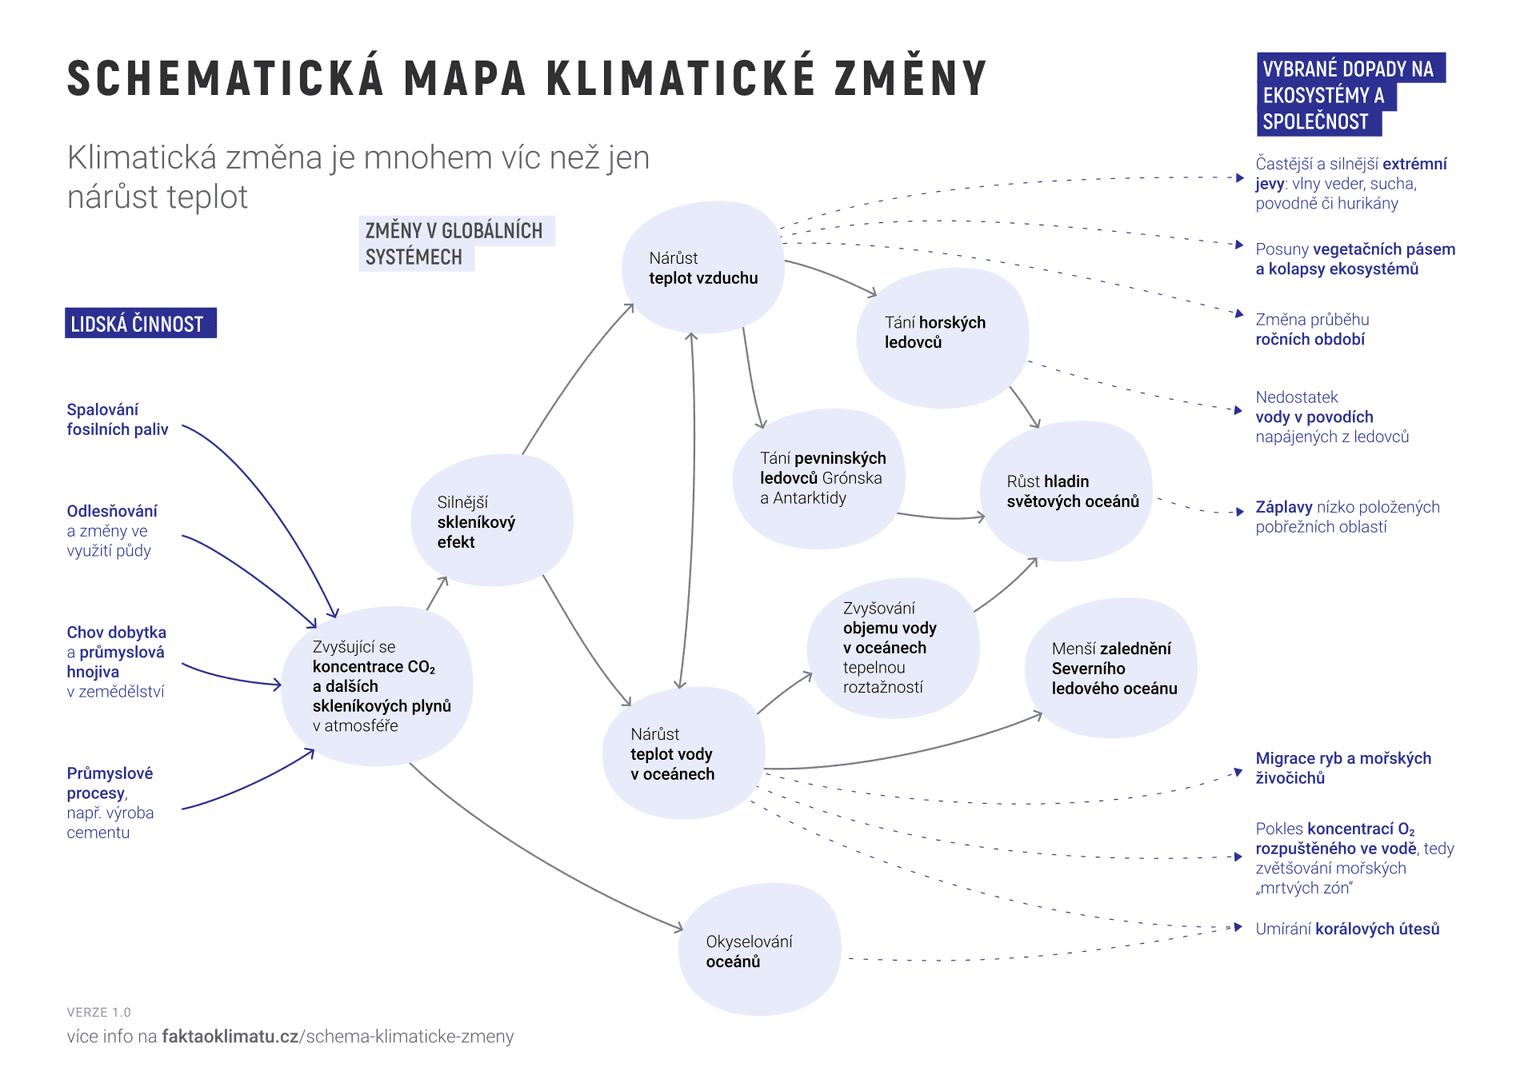
Ultimately, these phenomena may have fatal impacts on the functioning of human society, for example through the collapse of ecosystem services across extensive areas and the associated loss of food production capacity, or environmental migration in general as a result of changed living conditions.
Global warming of more than 1,5 °C already entails a risk that some parts of the planetary system will shift to a qualitatively different state; see details here, here and here.
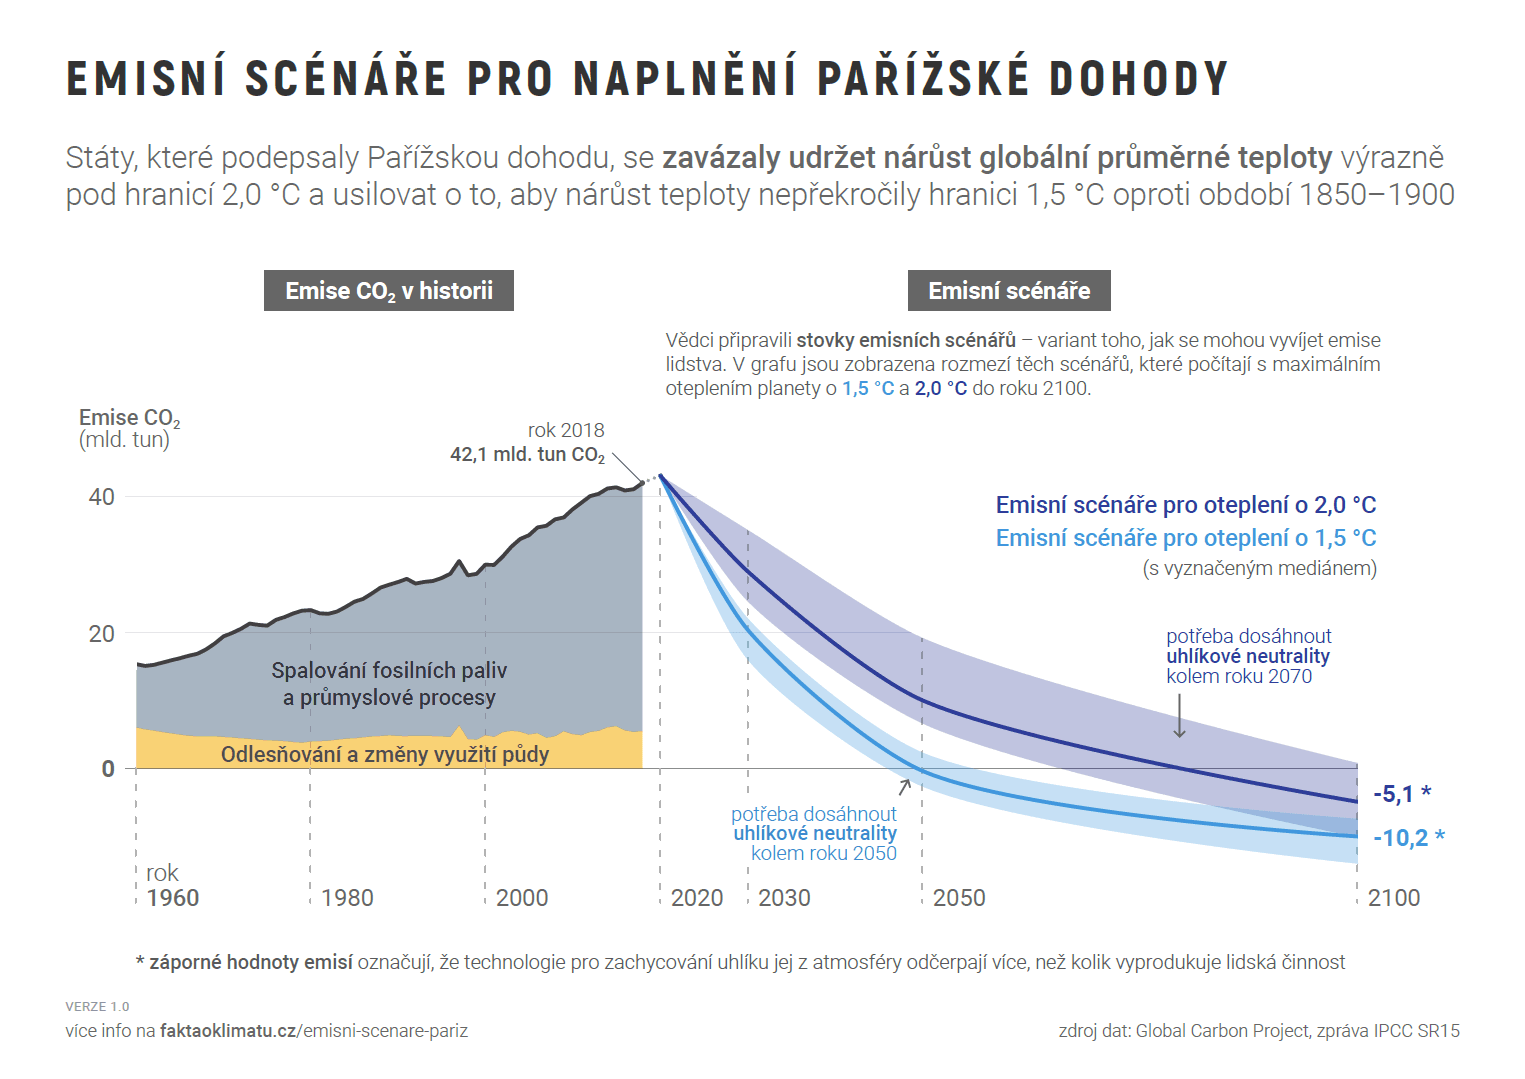
It is precisely for this reason that countries that signed the Paris Agreement committed to keeping the increase in global average temperature below 2 °C. Achieving this requires a significant reduction in CO2 emissions. By 2030, this means reducing emissions relative to current levels by approximately 25 (for a 2 °C warming scenario), or 50 % (for a 1,5 °C warming scenario). The earlier emissions volumes are reduced, the better. Otherwise, achieving the same maximum warming would require reductions along a much steeper trajectory, which is not only technically difficult but also entails a significant increase in associated costs.
If we continued releasing emissions at the current rate, by the end of the century we would reach average warming of more than 4 °C. Such a scenario would mean that, in the next 50 years alone, climate conditions would force migration by billions of people; see, for example, this study.
In an effort to meet their commitments and reduce their contribution to global climate change, numerous countries are undertaking a so-called coal phase-out.
What is a fossil fuel (coal) phase-out?
In this context, the English term phase-out denotes a gradual reduction in the use of fossil fuels. In the energy sector, this primarily means ending coal-fired electricity generation and replacing it with sources of significantly lower emissions intensity.
This term may also be associated, beyond the electricity sector, with heat generation, transport or industry in general.
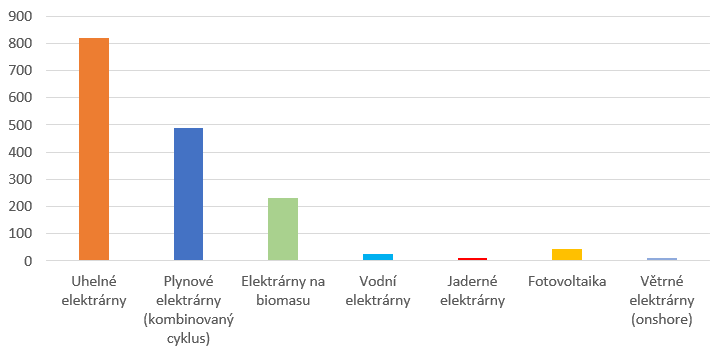
The decarbonisation process in Europe
According to the conclusions of the 2017 study A stress test for coal in Europe under the Paris Agreement, prepared by the international organisation Climate Analytics, achieving the goals of the Paris Agreement requires closing all European coal-fired power plants by 2030.
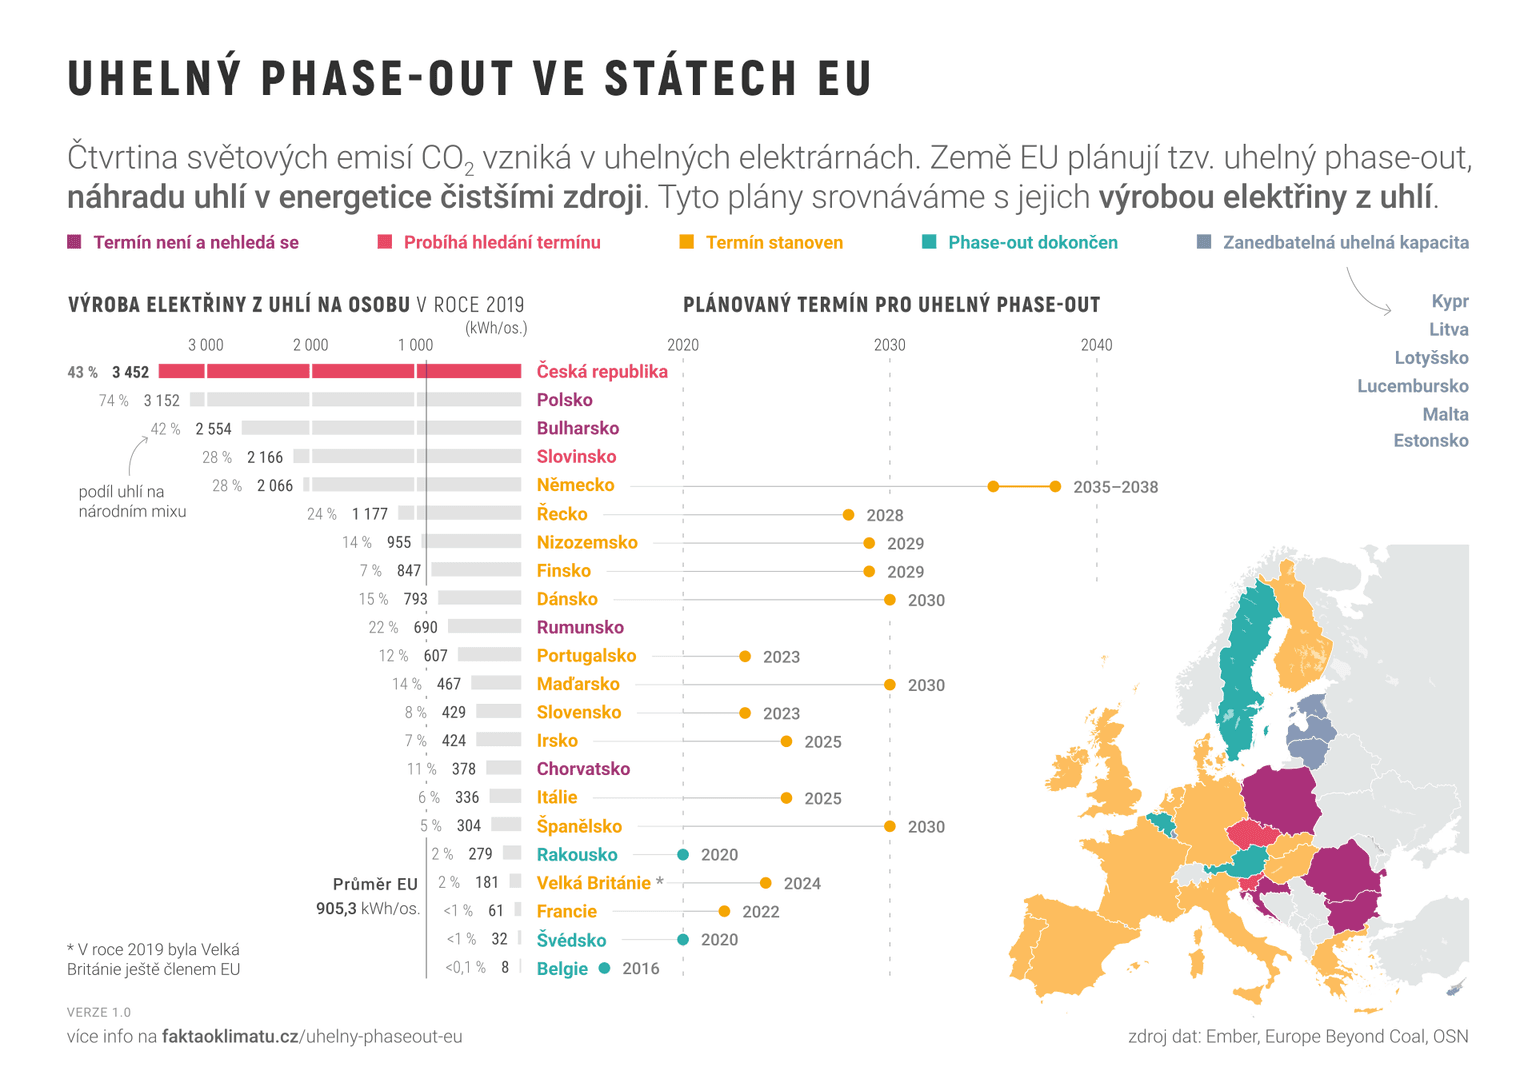
The current situation is that some European countries, particularly those with a lower share of coal capacity, have already completed their phase-out, while most of the others have set a final date for shutting down their last coal-fired power plant; see the overview in Chart 7.
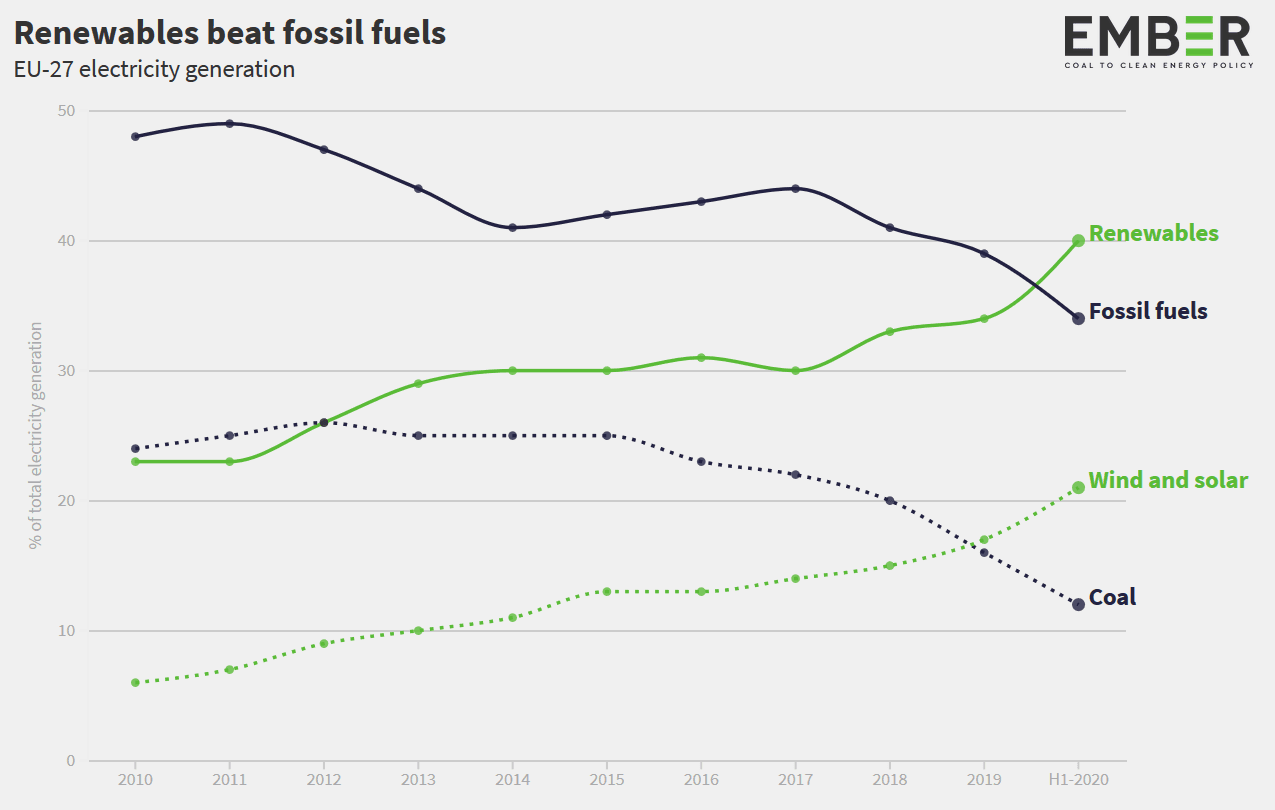
On average, in the first half of 2020, electricity generation from renewable sources exceeded that from fossil sources, while solar and wind power plants have generated more electricity in Europe than coal-fired plants since last year; see Chart 8.
Current situation in Czechia
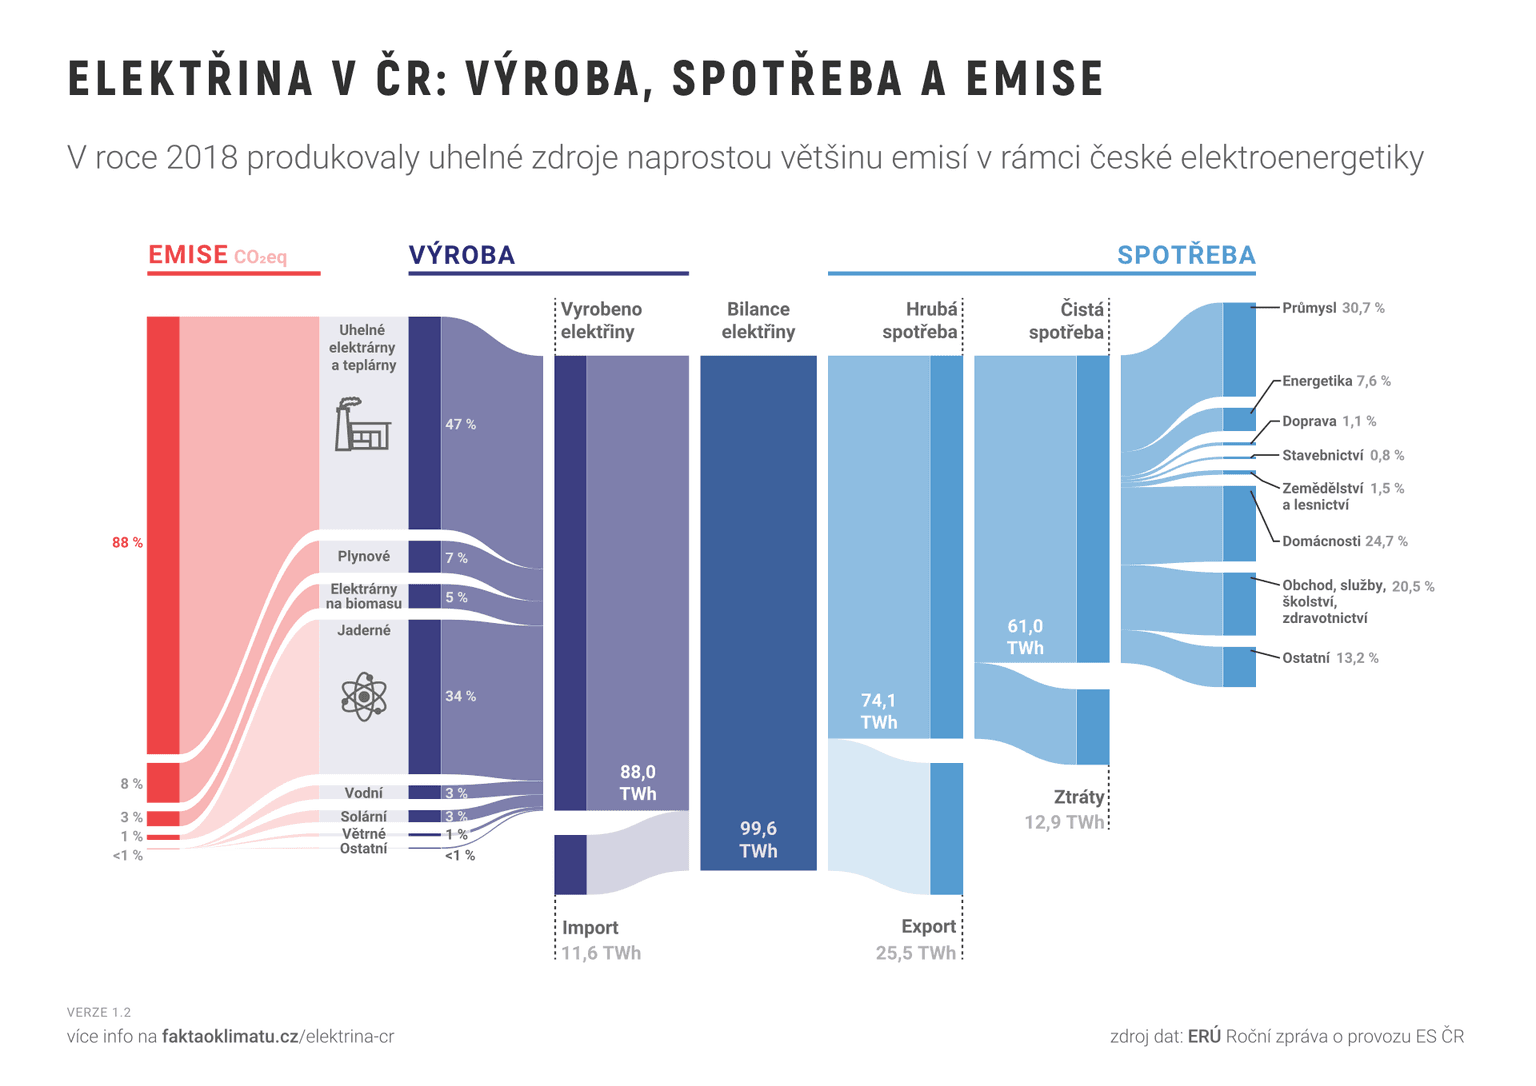
How does the Czech Republic itself fare? It is rightly described by local environmental organisations as Europe’s coal museum. This is because Czechia has the highest coal-fired electricity generation per capita in the entire EU. The same also applies to installed coal-fired power capacity per capita. See Chart 7 for details. Chart 9 shows the shares of individual sources in electricity generation in Czechia and the related emissions. As can be seen, coal-fired power plants accounted for 47 % of electricity generation in 2018, while producing 88 % of greenhouse gas emissions in the sector.
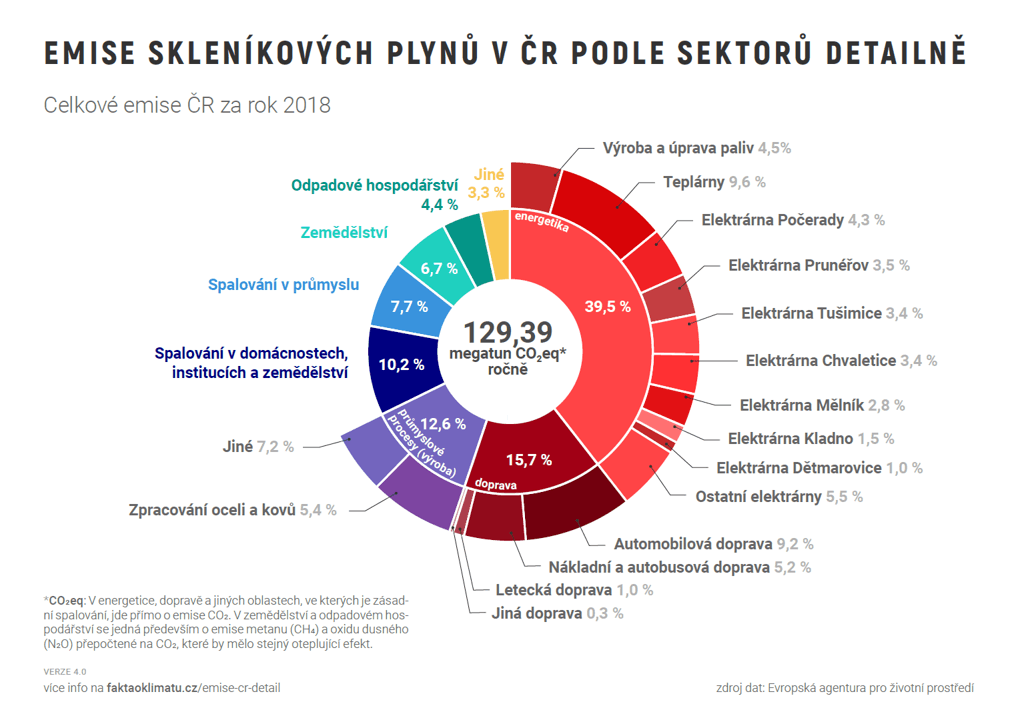
Given the volume of coal-fired electricity generation, it is no surprise that coal-fired power plants and heating plants in Czechia make a significant contribution to total greenhouse gas emissions across all sectors; see Chart 10. Due to the high emissions intensity of its domestic energy sector, Czechia ranks among the leading producers of greenhouse gases per capita, both within the EU and from a global perspective.
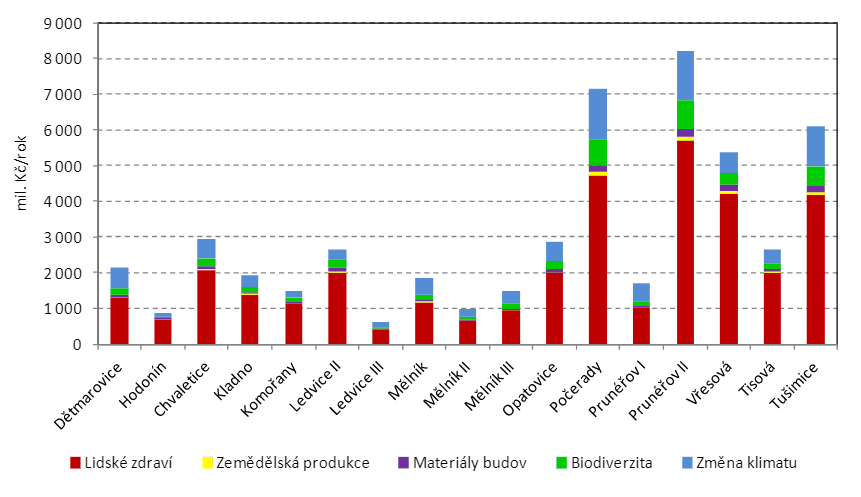
Besides CO2, coal-fired power plants are a source of a range of other pollutants that cause significant damage not only to the environment but also to human health. An older study by the Charles University Environment Centre in Prague calculated the resulting external costs at more than CZK 50 billion annually (at 2011 prices); see Chart 11. Ultimately, the damage caused is significantly greater than, for example, annual support for renewable energy sources.
For the reasons mentioned above, the prompt decarbonisation of Czech energy and the associated coal phase-out are highly desirable. To this end, the Coal Commission was established to set a timetable and method for moving away from lignite combustion. The decommissioning of Prunéřov I power plant, which took place at the end of June 2020, is therefore only the first step in this process, whose specific form has yet to be determined.
The next instalment of this series will address specific scenarios for the decarbonisation of Czech energy.
The author is an analyst at the AMO Research Centre and the Fakta o klimatu organisation.
Translation disclaimer
This article is a machine translation of the Czech original and has not yet been fully reviewed. In case of any doubt, please refer to the Czech version.
Sdílejte článek prostřednictvím:
You might also like

23 October 2026, 11:01
23 October 2026, 06:34