
23 October 2026, 14:38
Loading...
Utility-scale energy and more powerful new photovoltaic panels
Tomáš Foldyna
16 December 2021, 10:51
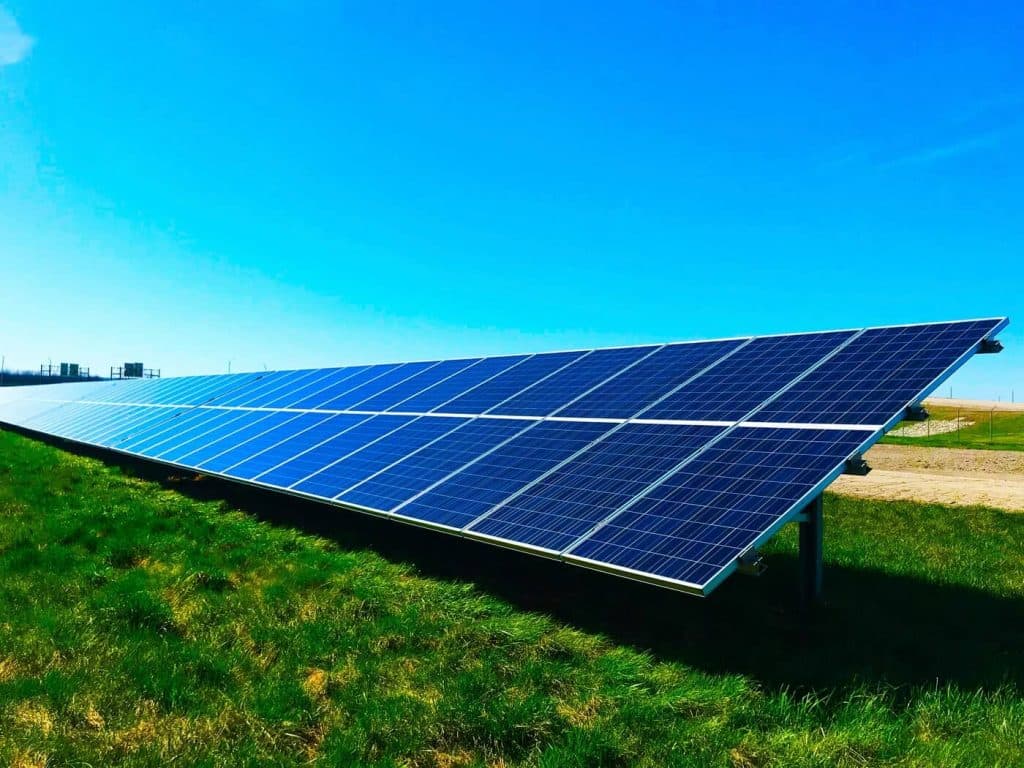
An article entitled “Study of scenarios for non-fossil electricity generation in Czechia” by Jan Horáček and Slavomír Entler was published on this portal some time ago in two parts. The subsequent discussion included considerable criticism, and even ridicule, over the use of panels with a peak output of just 200 Wp in calculations of material requirements. Many people did not understand that this material calculation was not the main subject of the article, but it was enough for them to discredit it. It is therefore necessary to examine the material aspect in somewhat greater detail.
Literate people have no reasonable doubt that, to achieve a given installed capacity, we will need only one-third as many 600 Wp peak-output panels as 200 Wp panels. To understand all the implications, however, we need to look at how the higher output is achieved. We will immediately show a long table listing the parameters of many panels—older, newer and essentially forthcoming ones.
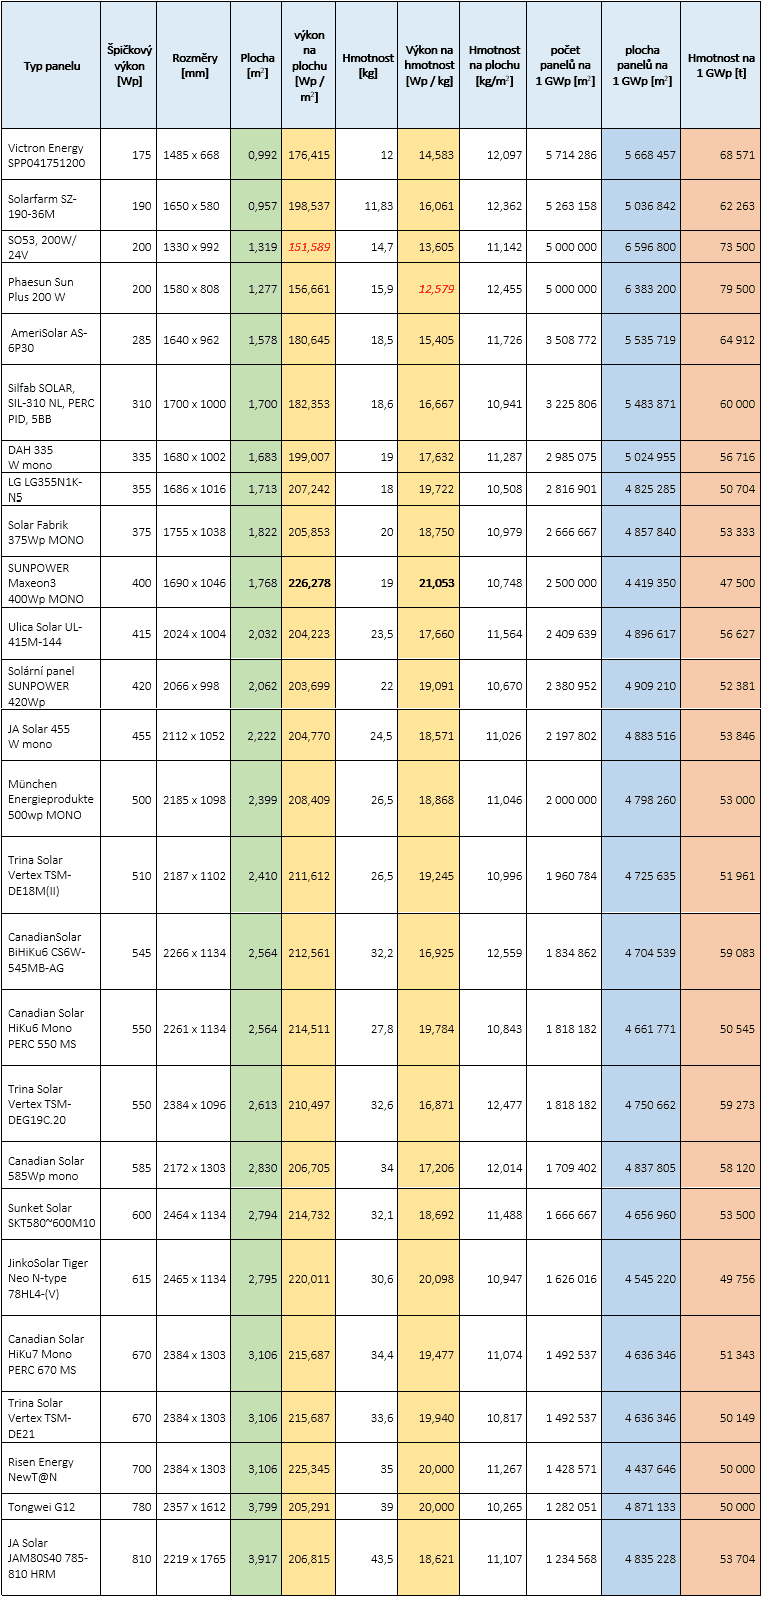
Note: somewhat different values for the listed panels can sometimes be found in different sources
I have deliberately highlighted some columns in colour. The green column contains panel area, the yellow columns contain specific output per area and per weight, the blue column shows the total panel area needed to achieve 1 GWp (one gigawatt of peak output), and the pink column shows the total panel weight needed to achieve 1 GWp.
A look at the table reveals two facts that are not at all surprising.
First, panel development is still ongoing and differences in panel efficiency undoubtedly exist. In our table, the difference in output per area between the best and worst panel is almost 50 percent (49.3%, 226.278 Wp/m2 vs. 151.589 Wp/m2). But this is truly an extreme case; otherwise, the differences are much smaller. A more powerful panel does not necessarily always have higher output per unit area.
Second, we can seethat the higher output of panels that are not far apart in generational terms is achieved largely by increasing the panel area. For example:
- The JA Solar 455 W mono, with an output of 455 Wp, has an area of 2.222 m2
- The Trina Solar Vertex TSM-DE21, with an output of 670 Wp, has an area of 3.106 m2.
With a difference in peak output of 47.3%, the difference in panel area is as much as 39.8%, while the difference in output per unit area is only 5.3%. That is, only a marginal part of the output increase was achieved by increasing the panel area.
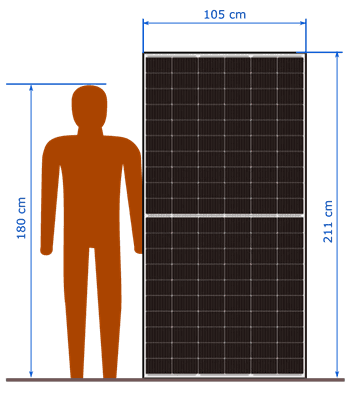
Comparison of the size of a JA Solar 455 W mono panel with 455 Wp output to a person.
We find similar differences in specific output per weight.
If we exclude the least efficient panels in the table, the differences in specific output are on the order of ten percent. Put simply, today we can produce larger and heavier panels, with a slight increase in efficiency.
Progress “within the limits of the law”
The above figures clearly put into perspective the celebratory cries about panels with peak outputs of 500, 600 or even 800 Wp, which in some people’s minds “change the rules of the game and the energy sector”. The truth is considerably more modest.
There is no doubt about tangible progress. The ability to mass-produce large, durable panels with an area exceeding 3 m2, efficiency of around 22%, specific output exceeding 220 Wp/m2, and stated linear degradation already below 0.4%–0.5% per year over 25–30 years (if we believe the manufacturers’ degradation data…) is an amazing achievement from a scientific and technological standpoint. All the developers, scientists and technicians involved deserve admiration. It is a huge difference compared with the previous 10–20 years.
But...
Despite all the progress paid for by billions of euros, over the past decade it has not been several-fold, let alone an order-of-magnitude, improvement. We are slowly approaching physical limits step by step.
- For 1 gigawatt of installed peak output, we still need at least one million panels, even if we were to produce even larger 1,000 Wp units.
- We need not deceive ourselves with simple numbers. Whether we use 1 million larger panels or 3 million smaller ones, their area—the net area of the panels themselves—will be somewhere between 4.4–6.6 km2 per 1 GW (the area of the actual plant will of course be much larger).
- The total weight of the panels will be between 47,000 and 79,000 tonnes per gigawatt.
No magical miracle has occurred that would turn photovoltaic power plants into cheap, resource-light “boards” that we churn out cheaply “like sausages” and sell almost for free. Nothing of the kind. Every, especially larger, installation involves only hard calculations, finance, logistics and a struggle for savings within percentages—at most tens of percent—for each individual installation. This involves thousands of tonnes not of “dumb” concrete and steel, but of relatively sophisticated products where quality plays an important role.
Do larger panels bring any benefits? Yes, why doubt it?
Larger and smaller panels in a power plant on a brownfield site
We people very much like to quote installed-capacity figures, but fewer of us realise what lies behind them. To compare the difference between more and less powerful panels, we will use three panels from our table with outputs of 335, 500 and 700 Wp.
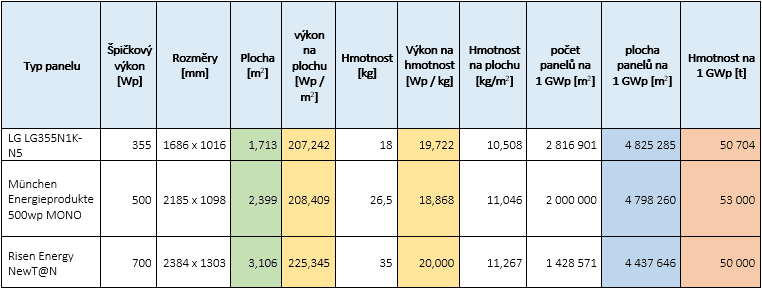
Now let us imagine that we are building a power plant on a brownfield site somewhat larger than Ralsko (Ra 1 to Ra 3). According to Wikipedia, it has installed capacity of 55.8 MW; for our calculation, let us choose a plant capacity of 60 MW.
The first natural question is how many panels we will need. The calculation is very simple.
- LG LG355N1K-N5 with an output of 355 Wp – 169,014 panels, panel weight of 3,042 tonnes
- München Energieprodukte with an output of 500 Wp – 120,000 panels, panel weight of 3,180 tonnes
- Risen Energy NewT@N with an output of 700 Wp – 85,714 panels, panel weight of 2,999 tonnes
What specific benefits will larger panels bring us in this project? As for price, it is not entirely certain whether 85,000 larger panels will cost less than 169,000 smaller ones and, if so, by how much. Their combined weight is very similar. Savings will certainly arise in the following areas.
Transport costs
Large quantities of panels are usually transported on pallets in standard 40-foot, or 12.19 m, containers. This is the larger container, not the smaller 20-foot one. Manufacturers usually state how many panels they normally load into a container. Again, we have a simple calculation:
- LG LG355N1K-N5 with an output of 355 Wp – 650 panels per container = 260 containers
- München Energieprodukte with an output of 500 Wp – 620 panels per container = 194 containers
- Risen Energy NewT@N with an output of 700 Wp – 558 panels per container = 154 containers
We will undoubtedly save on transport costs: 68% compared with 355 Wp panels and 26% compared with 500 Wp panels. Transport costs depend on distance, conditions in freight transport, supply, demand and other factors. At a transport price of EUR 3,000 per container from China, the saving would be EUR 318,000; with current fluctuations to nearly EUR 9,000, as much as EUR 954,000 could be saved. The saving may ultimately be slightly lower, because paradoxically we may receive some discount for a larger number of containers.
EUR 300,000–950,000 is very decent money, but let us outline the price range involved. For large contracts, it is really difficult to estimate what the unit price of a panel will be. Let us imagine that the unit price came to a very favourable EUR 70 for the Risen Energy NewT@N, well below retail prices. We would then pay almost EUR 6 million for the panels alone. The transport-cost saving is interesting, but unfortunately we will not build another power plant with it—not even half of one.
Let us also mention the cost of the so-called last mile. If we transport the panels by ship and then by rail as close as possible to the plant, let us say that the final 30 kilometres still need to be covered by road.
This means covering 15,600 km by tractor-trailers with containers, there and back (260 containers x 30 x 2). With more powerful panels, this comes to 11,640 km and 9,240 km, respectively.
Installation costs
This would require a calculation by someone who actually delivers such projects; we will only make a rough estimate. Installing a smaller number of panels means fewer tasks, and therefore less labour time and machinery operating time. Entirely hypothetically, if installing one panel required the effort of 2 people for just 3 minutes, it would work out as follows:
- LG LG355N1K-N5 – 169,014 panels, 16,901 person-hours
- München Energie produkte 500 w – 120,000 panels, 12,000 person-hours
- Risen Energy NewT@N – 85,714 panels, 8,571 person-hours
Using a labour cost of, say, EUR 15 per hour, we get amounts of EUR 235,000 vs. EUR 180,000 vs. EUR 128,000. Again, this is an interesting saving, but it is not even one-tenth of the optimistic panel price.
The other side of the coin is the higher panel weight. There may be a difference in handling a panel weighing 18 kg, 26.5 kg or as much as 35 kg. Total installation costs may therefore not be that much lower for larger panels.
We also need a supporting structure. This may be made of steel or aluminium. Here, the savings for more powerful but larger panels will be relatively small, because the total panel area is very similar. There are various support structures, with required weight stated at 8–25 kg per 1 m2 of panels. If we calculate with 8 kg per square metre of panels, we get:
- 2,316 tonnes for LG LG355N1K-N5
- 2,303 tonnes for München Energie produkte 500 w
- 2,130 tonnes for Risen Energy NewT@N
The support structure will also have its own manufacturing, transport and installation costs.
We will also show approximately how much area our 60 MW plant will occupy. There must of course be gaps between rows of panels so that they do not shade each other, and also for accessibility.
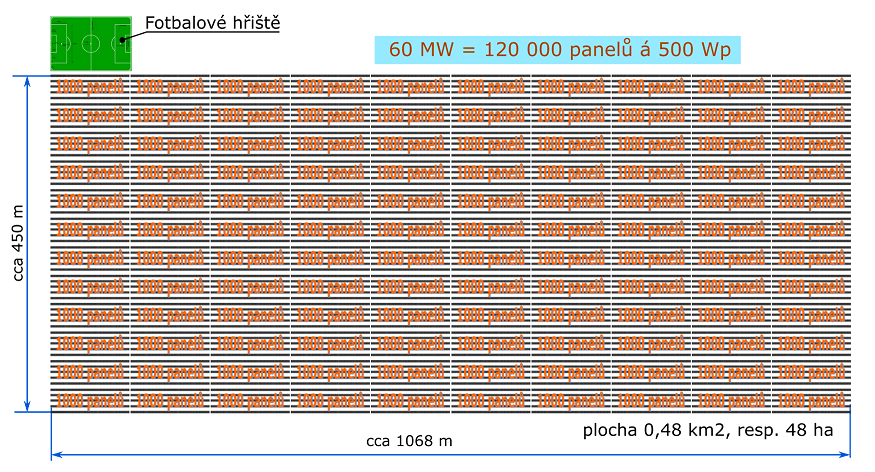
Approximate theoretical size of a 60 MW solar power plant with four panels arranged horizontally one above another.
Of course, the actual area of a particular power plant will vary according to the terrain and the panel layout. Wikipedia gives just 29 ha for the 55.8 MW Ralsko PV plant, but for other plants with lower capacity it gives areas of 82.5 and 60 ha, respectively. In other words, the result in our drawing may correspond quite closely to reality.
The power plant also includes other costs, such as cabling, inverter(s), transformer, connection to the electricity grid, fencing and security systems.
For every gigawatt of capacity, we would need to build almost 17 such power plants. When someone enthusiastically writes about installing many gigawatts of PV, every reader can now surely imagine the effort and material flows required.
We will write about rooftop installations another time.
Panel output matters, but …
It is clear to any thinking person that the problem with PV is not whether we use 200 Wp or 800 Wp panels. The main problem with PV is clearly shown by the following very basic graph.
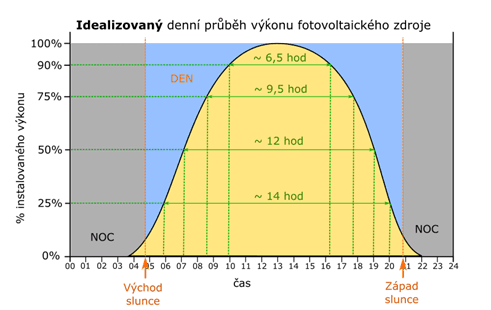
Even the highly idealised output profile under favourable conditions speaks plainly. We can buy new 800 Wp panels instead of old 200 Wp ones, and during the night hours we will still get the same zero.
Even if a panel had better efficiency at lower irradiance, we would get only a slightly better curve, and output in the early morning and late afternoon would simply remain low.
If we move from the ideal world to the real one, the graphs become even more telling.
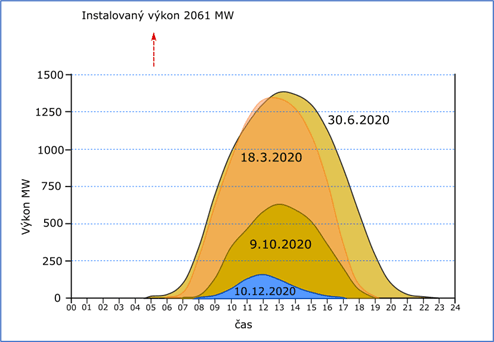
Comparison of solar power plant output on selected days in Czechia in 2020. Data source: ENTSO-E Transparency Platform
Please note that even on the most favourable days in June, we did not reach the existing installed capacity of 2 GW.
To avoid tiring readers too much, I will show just two more graphs. Let us imagine that by sometime in 2026 we build another 3 GW of solar capacity, giving us around 5 GW. In other words, 50 of the above-mentioned 60 MW power plants. We only need to buy, transport and install 4.285 million 700 Wp panels.
Now let us simulate, using real data from 2020, how the given 5 GW of solar capacity would contribute to covering Czech electricity consumption if a similar situation in terms of sunshine and consumption occurred.
First, a favourable month—June.
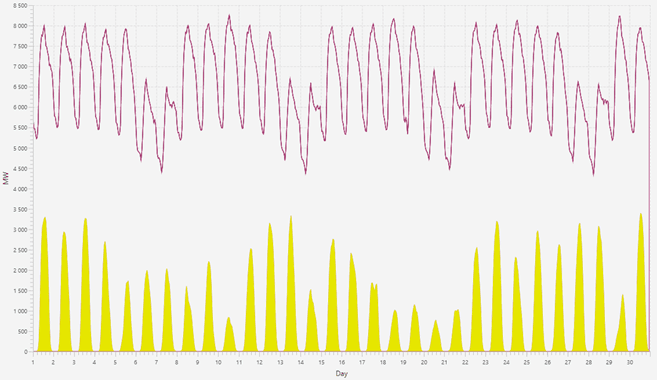
Coverage of Czech electricity consumption by 5 GW of photovoltaic power plants – projection for conditions in June 2020. Data source: ENTSO-E Transparency Platform
The gaps at night are obvious; we cannot erase them even by multiplying capacity many times over. To be truly cynical, trying to cover a country’s consumption with photovoltaics is like scooping up water with a rake. Yet we have, as it were, installed “five Temelíns”, which sounds rather absurd when looking at the graph.
Because of the treacherous movement of the Earth around the Sun, winter also arrives. For example, in January the graph for the same 5 GW looks as follows:
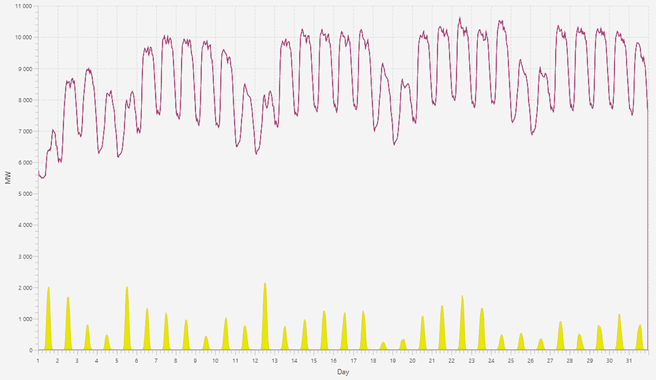
Coverage of Czech electricity consumption by 5 GW of photovoltaic power plants – projection for conditions in January 2020. Data source: ENTSO-E Transparency Platform
I think the graphs are sufficiently eloquent and there is no need to add more words.
Conclusion
There are many cases where installing photovoltaics represents a very good option and will effectively serve its purpose.
On the other hand, efforts to replace stable and dispatchable electricity sources with photovoltaics on a large scale are highly questionable. Or to try to make it the “decisive” source of electricity using currently available technology.
Despite the interesting evolution and cost savings from using modern panels, no revolution is taking place yet. Particularly in our geographical conditions, mass deployment encouraged by subsidies and, worse still, operating support is unfortunately more akin to criminal waste of taxpayers’ money.
It is considerably better and fairer to remove as many bureaucratic obstacles as possible for private entities to make their own local installations (with their own money), perhaps also provide favourable loans, let the market operate and allow natural pressure to improve panel characteristics. By subsidising current technologies, we are only slowing development.
Photovoltaics are neither bad nor good. They have their characteristics and, if we know them, we can deploy them effectively. You can read more about the characteristics of photovoltaics in the freely available publication “Photovoltaics realistically”.
Sources:
ENTSO-E Transparency Platform, https://transparency.entsoe.eu/
https://shop.iftech.cz/12-solarni-panely
https://jinkosolar.eu/files/jinko/download/JKM595-615N-78HL4-(V)-F1-EN.pdf
https://www.pv-magazine.com/2021/10/08/risen-showcases-n-type-solar-panel-with-output-of-700-w/
https://www.pv-magazine.com/2020/08/18/a-closer-look-at-ja-solars-new-785-810-w-panel-series/
https://www.enfsolar.com/pv/panel-datasheet/crystalline/47372
https://drive.google.com/file/d/1w-gV4CMAnAoJSTrpWlRlHgk3IHua4kC-/view?usp=sharing
Translation disclaimer
This article is a machine translation of the Czech original and has not yet been fully reviewed. In case of any doubt, please refer to the Czech version.
Sdílejte článek prostřednictvím:
Topics:Opinion
You might also like
23 October 2026, 11:01

23 October 2026, 06:34