How much PV really generates in December and what the full year looks like in Czechia
Many claim that PV generates virtually nothing in winter and produces only unwanted surpluses in summer. So let us look at what this “nothing” actually looks like.
December is the worst month for PV at our latitudes. Around the winter solstice, the day shortens to a minimum and the sun is low above the horizon. The sun’s rays therefore hit the panels at a steep angle, while even the smallest nearby obstacle often shades the roof—not to mention when snow falls on the panels. Winter conditions are therefore not particularly favourable for generation, while household consumption rises as more heating is needed as temperatures fall.
On the other hand, the seemingly pitch-black situation is not quite so dire. There are still some sunny days in December, and lower temperatures increase panel efficiency, so PV does generate something even in December. So what did actual generation and consumption look like in December 2024?
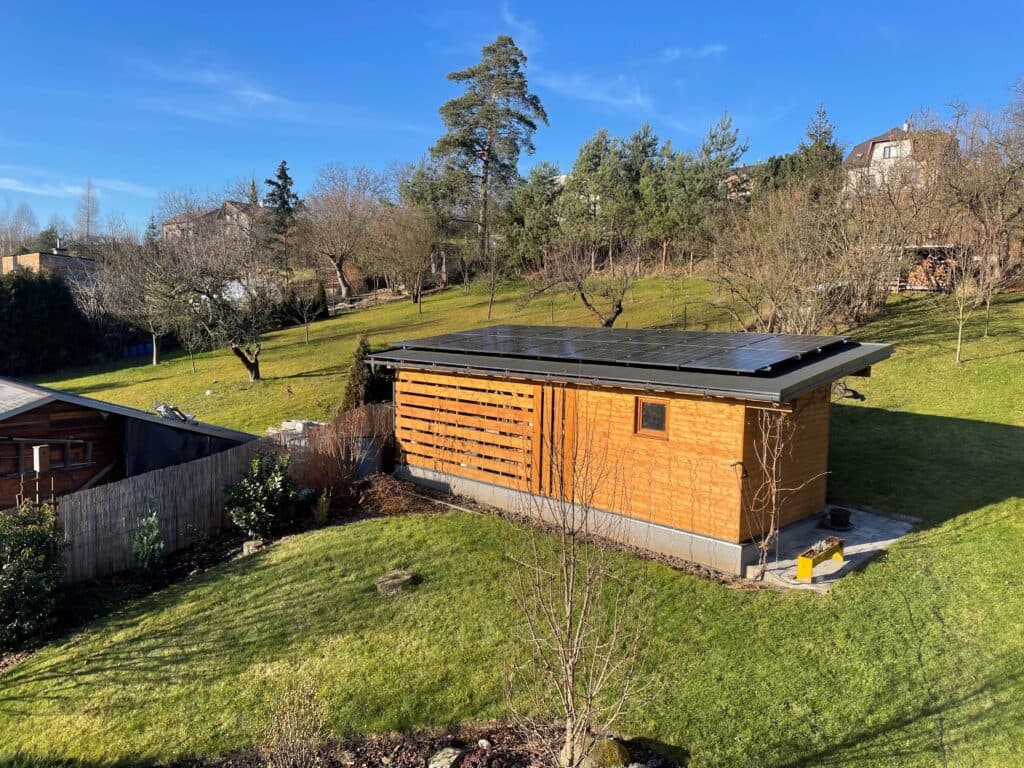
The property in question is a renovated detached house with two above-ground floors and a heated basement. Heating is provided by an air-to-water heat pump supplying underfloor heating. During the summer, the attic is cooled by a conventional air-conditioning unit. The house is occupied by a family of four, with some working from home. The house was fitted with 5.5kWp of PV and an 8kWh battery. In April 2024, capacity was increased to 10kWp (+24kWh of battery storage).
Total consumption at the property was 988kWh in December, of which 830kWh was used by the house and 158kWh by the car, which travelled around 800km. Generation, meanwhile, reached 318kWh, corresponding to roughly one-third of consumption including the car’s mileage. While this is still far from covering total consumption, covering a full third of consumption including car travel in the worst month of the year is not so bad. In any case, PV generation needs to be viewed in the context of the full year. The following chart shows generation and consumption over the year. Consumption was essentially stable at around 600kWh per month from February to October. Lower figures in February, August and September were due to holidays away from the property. Higher consumption therefore relates to the period from mid-November to mid-February; however, in a well-insulated house, the winter increase in consumption is not so significant.
Generation, by contrast, fluctuated between roughly 300-1300kWh per month. Until April, the installed capacity was approximately half its later level, showing that it was somewhat undersized relative to consumption. Conversely, November and December show that a suitably sized system can cover around one-third of consumption. Such a system can then readily cover total consumption in aggregate from March to October. In summer, it produces more overall than is drawn from the grid during winter.
As a supplement, it is also necessary to add a chart of grid imports for the whole year. Imports even during the summer months are due to a certain number of cloudy days or inverter control options.
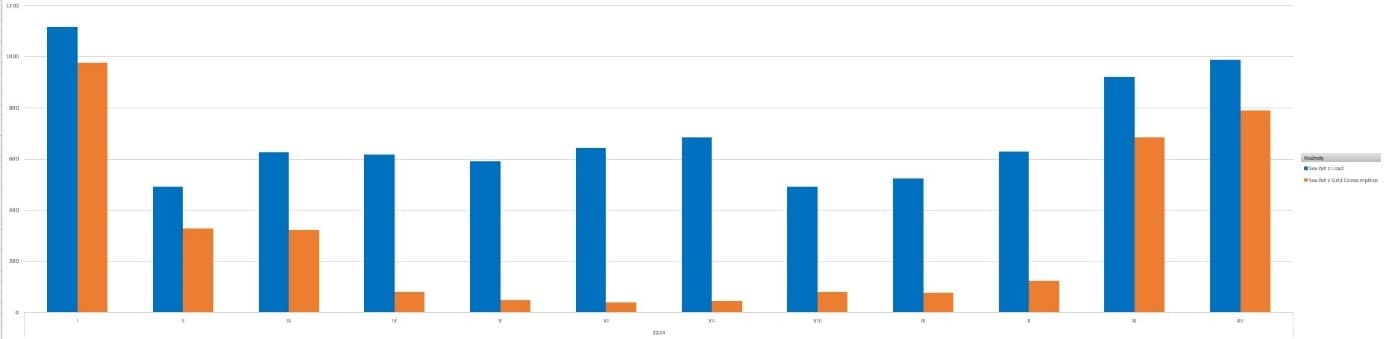
On an annual basis, PV generates more than the property itself consumes. With the full 10kWp capacity in place for the entire year, total generation would be around 10MWh, roughly 20% more than consumption itself.
“Unwanted” summer surpluses
As the charts show, PV generation in summer exceeds consumption by around 2x. I sell these surpluses back to the grid under a spot-price tariff. However, this sale also has its own specifics. While prices are high in the morning and evening, they often fall to zero or negative territory at noon, when generation is highest. PV therefore needs to be controlled so that the stationary battery is charged mainly when prices are low, while exports are targeted at higher-priced periods. Within the limits of its battery capacity, PV with storage is a highly flexible source that is easy to control—the full principle is described here. https://zdopravy.cz/vlastni-zkusenost-jak-zkrotit-fotovoltaiku-a-kolik-vlastne-stoji-provoz-elektroauta-219622/
Over the summer season, this made it possible to achieve an average feed-in price of around 2.3Kč/kWh, which partly covered electricity purchases from the grid. Next year, with full capacity, summer exports can be expected to fully cover grid imports financially.
How much does running an electric car cost?
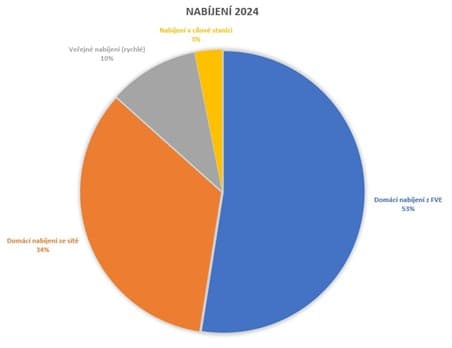
Roughly a quarter of consumption in 2024 was attributable to operating an electric vehicle. For total mileage of nearly 14,000 km, more than 2000kWh was charged at home and another 300kWh away from home. More than 50% of the mileage was thus covered by PV charging, one-third by charging from the grid at home, and the remainder by charging at DC stations or at destination chargers. The costs break down as follows. For PV charging, the average price at which the electricity could otherwise have been sold to the grid needs to be included, which can be estimated at around 1.5Kč on an annual average basis. For grid charging, a kWh including distribution costs around 5Kč. At DC stations, charging cost around 13Kč on average. On an annual average basis, a kilometre of driving costs around 70 haléřů, representing savings of around 1.6Kč/km compared with petrol.
Conclusion
As the measured data show, PV generation will never match consumption under our conditions. If we wanted to cover all consumption at least in monthly totals, the installation would have to be another 3-4x larger, with a proportionally larger storage capacity; even then, such a large installation would probably be unable to cover several cold, cloudy days in a row. At current prices, this would not be economically justifiable. However, the data also show that self-sufficiency above 60% can be achieved with a sensibly sized PV system. The data show self-sufficiency of 57%, due to the lower installed capacity during the first four months of the year. With full capacity in place throughout the year, the figure would significantly exceed 60%. In this case, sales of surplus electricity can largely cover winter purchases. What remains are the fixed charges for the connection point, which must be paid in any case.
It is also necessary to emphasise the link between system sizing and heating consumption. If the property were poorly insulated, the share of heating consumption in the cold months of the year would increase, reducing overall self-sufficiency.
Recommendations
Based on current experience, several points can be recommended to property owners:
- Before installing PV, ensure the property has as many electric appliances as possible, ideally controllable ones such as a large hot-water tank, heat-pump heating, an electric cooker, etc.
- If the property is heated electrically, it is better to reduce consumption through improved insulation rather than unnecessarily oversizing the PV system.
- Especially for PV owners, purchasing an electric vehicle is worth considering, as it significantly improves PV economics. If a family owns two cars and does not use one of them for long journeys, a used electric vehicle can be an option, with a price very similar to that of an equivalent combustion-engine vehicle.
Author:
Graduate in vehicle design from the Faculty of Mechanical Engineering at the Czech Technical University in Prague.Technical project manager in regional train development.Enthusiast for new technologies in energy and mobility as a path towards a more sustainable future.More articles by the author can be found on his blog on Seznam Medium.
Translation disclaimer
This article is a machine translation of the Czech original and has not yet been fully reviewed. In case of any doubt, please refer to the Czech version.